Last week I began this series of blog posts about the Ancestry.com Image Processing Pipeline (IPP) by briefly describing how the IPP is the part of the Ancesty.com Content Pipeline that is responsible for digitizing and processing the millions of images we publish to our site.
With this blog post I would like to discuss the scale of our operation and hopefully give you a sense for the number of images that we handle in the IPP in a way that is instructive. But more importantly, before you can understand the IPP architecture and the trade-offs we have made in building it out (which I will discuss in future blog posts), you need to understand the sheer volume of images that we process.
Living in the Mesosphere
If you go look at the Ancestry.com Card Catalog, it’s pretty clear that we give access to a lot of content. It shows that you can access (through the filtered search panels on the left side of the page) over 30,000 titles.

If you look at the second title listed above in the screenshot of the Card Catalog, you will see listed the 1940 U.S. Federal Census. This record collection consists of about 4660 rolls of microfilm, digitized to about four million high-resolution images, all of which were brought online in only a few days. By any measure, that’s a lot of images and a fast turnaround.
Over the last several years Ancestry.com has been very aggressive about: 1) bringing together teams of professionals who are passionate about delivering great content to our subscribers, and then, 2) pushing these teams to create technology, processes, software architectures and applications that make it possible to acquire and process this content at an unprecedented scale and scope. I see this in the works every day, but probably never at such scale as our effort last year to publish the 1940 U.S. census online. And that’s just one of the more than 30,000 collections available on our site.
In his 2013 RootsTech keynote address, Tim Sullivan mentioned that last year we added 1.7 billion records to our site for a total of 11 billion records. He then added that we’ll be investing even more money into adding content online – $100 million dollars over the next 5 years. That’s a lot of images.
To illustrate the scale and volume of images being processed at Ancestry.com, I like to use an analogy relating an image to a sheet of paper. Consider the following figure in which I suggest you think of an image as a single sheet of paper. If we stack about 500 sheets, a single ream of paper, it makes a stack about two inches tall.

Now stack about 25 reams on top of each other, as shown in the above figure, and you have a four-foot visual representation for what 12,500 images might look like.
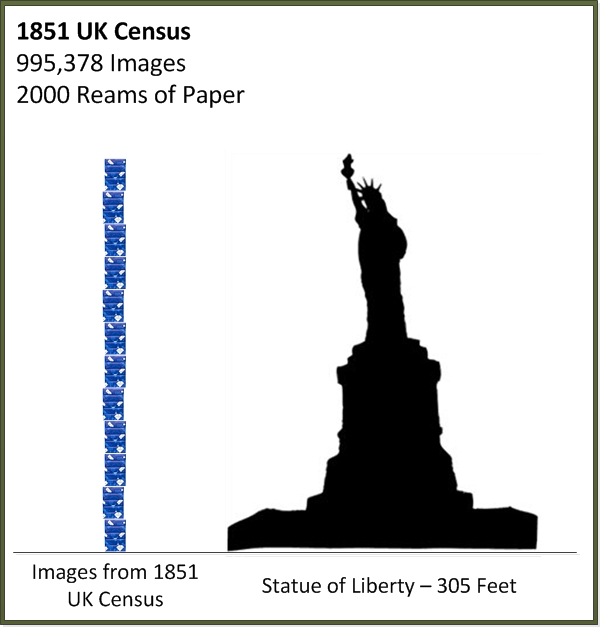
Continuing with this analogy, what would the stack of “images” look like for the 1851 UK Census? As shown in the following figure, this collection of almost one million images would be about the height of the Statue of Liberty.
How about all of the 1851 to 1901 UK Censuses? If you were to stack each “image” from all of these censuses as individual sheets of paper, how high would this stack reach? The figure below shows that this stack extends to 2,133 feet, significantly higher that the Sears Tower in Chicago, Illinois.

Finally, extending this analogy to its limits, if you were to stack every image (as a sheet of paper) from all of our collections, how high would this stack reach? In the figure below I show that it reaches up to a height of over 166 thousand feet. This is a stack of images 31 miles high, which puts you well into the mesosphere. We’re adding roughly another half of a mile every month, so it will be a bit before we make it into the thermosphere.

So, what’s the point? Are these paper-stacking comparisons just an over-the-top, poorly-disguised attempt to brag? Probably. But for a purpose. It would be easy to misunderstand my intent in presenting these numbers and comparisons.
Here’s my thinking. The size of Ancestry.com’s image database is truly extraordinary. We realize that processing millions of images a week could cause conventional technologies to break down and most off-the-shelf approaches don’t even get you in the ballpark. Many people have worked several years to develop the technology and infrastructure for this valuable resource. Furthermore, we now have in place the technology and tools to improve this resource at an even accelerated rate. So while we’re focused on acquiring, digitizing, indexing, and then publishing as much quality historical content as we can at an accelerated scale, we’re doing it with the ideal technology for the mass amounts of data and images we are handling.
As I stated at the start of this blog post, and as a unifying theme in my subsequent posts, we have had to think about things in a whole new light in order to operate at this scale. How this “thinking in a whole new light” actually got turned into a working pipeline will be covered in my future blog posts.