Since May of 2012, when we first released AncestryDNA, we’ve returned results to over a quarter of a million customers.
Based on feedback that we have received, those 300,000 customers have learned a great deal about their family history – their deep ancestral origins and their genetic relatives.
As it turns out, AncestryDNA has also learned a great deal from our customers. We’ve uncovered some interesting statistics about ethnicity estimates that may help you to learn a bit more about your own family history – and we’ll share them with you in this blog post.
At AncestryDNA, we estimate a customer’s genetic ethnicity as a set of percentages in 26 regions around the world. See map a map of these regions below.
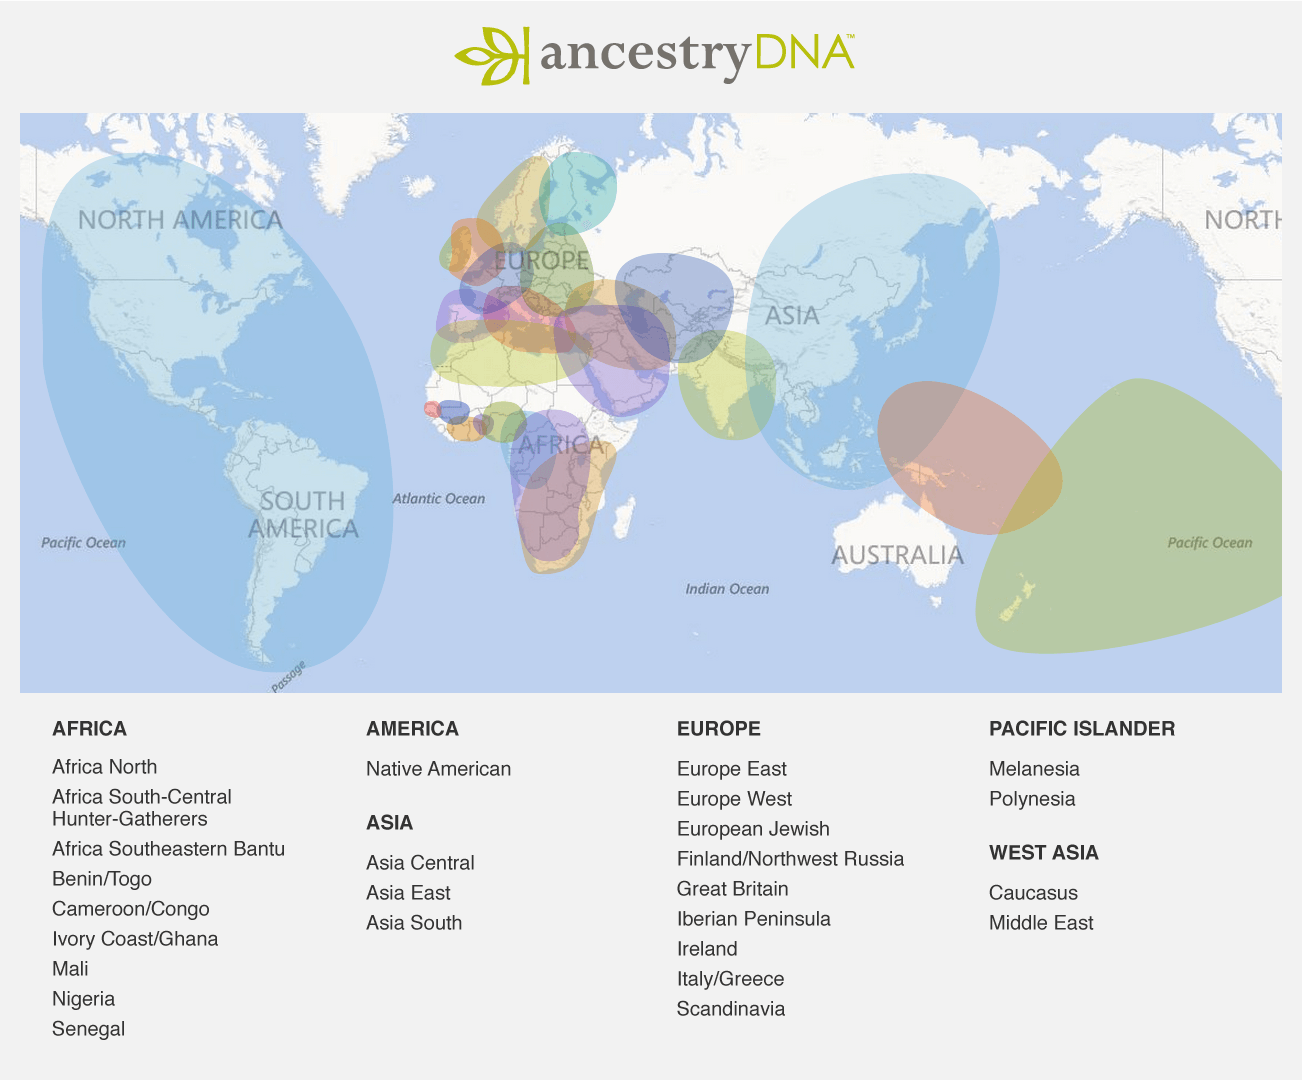
We estimate the amount of DNA that a customer likely inherited from each of these regions by comparing a customer’s DNA with a reference set of DNA samples – with corresponding documented family trees – from each of these regions. For a deeper dive into the science of ethnicity estimation, take a look at my previous blog post on the subject.
Below is an example of an AncestryDNA ethnicity estimate. In this post, we’ll explore what AncestryDNA ethnicity estimates look like across all of our customers – specifically, how many of these 26 regions show up in someone’s estimate?
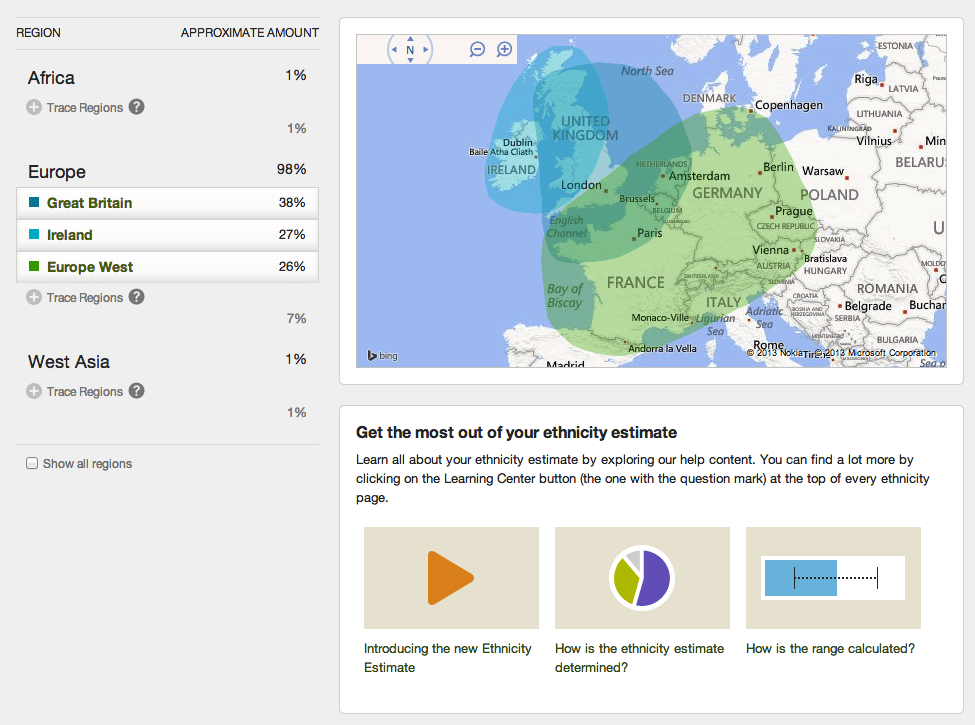
Based on the percentages estimated for a customer, we place each region into one of three categories. Main Regions are the primary regions from which you likely inherited DNA (the regions, pictured above, that you see when you first view your ethnicity estimate); Trace Regions have less evidence of being part of your genetic ethnicity (and are viewed by clicking on the “+” button); Other Regions Tested have even less or no evidence, and do not show up as part of your ethnicity estimate.
In exploring the aggregated genetic ethnicity results of customers who opted in to scientific research, here are a few fun facts we’ve found about the diversity of regions found in customers’ estimates:
- Ethnicity at a continental level – First, it’s interesting to view a person’s ethnicity estimate by continent. Our 26 regions can be broken into six different continental regions – such as Africa, Europe, and West Asia (see the estimate above). On average, we see that customers can trace their DNA back to 2.3 different continents. While half of our customers have 2 continents or more as part of their ethnicity estimate, some have only one continent — and others have all six!
- Main Regions in an ethnicity estimate – According to U.S. Census data on census.gov, “the overwhelming majority (97 percent) of the total U.S. population reported only one race in 2010. This group totaled 299.7 million. Of these, the largest group reported white alone (223.6 million), accounting for 72 percent of all people living in the United States.” This is thought-provoking because while most Americans self-identify with only one ethnicity, our database shows that some customers can be linked to as many as 11 main regions (or ethnicities), and the average is nearly four regions! See a graph representing the number of main ethnicity regions per customer, here. A person’s ethnicity is likely far more nuanced than they may report on a census.
- Expanding to include Trace Regions – While main regions are those with strong evidence that they are part of someone’s genetic ethnicity, trace regions are those that have a smaller amount of evidence (and that you must click on the “+” sign to view). When we count up regions in both of these categories, customers can be traced back, on average, to 8.5 different regional ethnicities. This really affirms that our customers hail from a variety of cultures and regions across the world. Some customers even have 24 out of the possible 26 regions as part of their estimate!
- African regions – We made an exciting new finding recently that African Americans have on average more than three African regions in their estimates on average. This shows that African Americans too are a melting pot of many unique African ethnicities.
These statistics and averages demonstrate the diversity of regions often found in an AncestryDNA customer’s ethnicity estimate — and prove that Americans are truly a mix cultures and influences from across the globe.
Advances in science and DNA research are just now beginning to make a significant impact on how we understand ourselves and society at large. While DNA testing often confirms the expected, it can also reveal the completely unexpected. How do your AncestryDNA results compare to our findings?